Anthropometry of Olympic Athletes 2016
In 2016 the IOC released a database of height, weight, birth date, sport and country containing data from most of the Rio Olympic Games participants. I have analyzed the data of the 11,538 participants using the results for height, weight, birth date, sport and country. Here are my analysis of the data.
Heights of 2016 Olympic Athletes
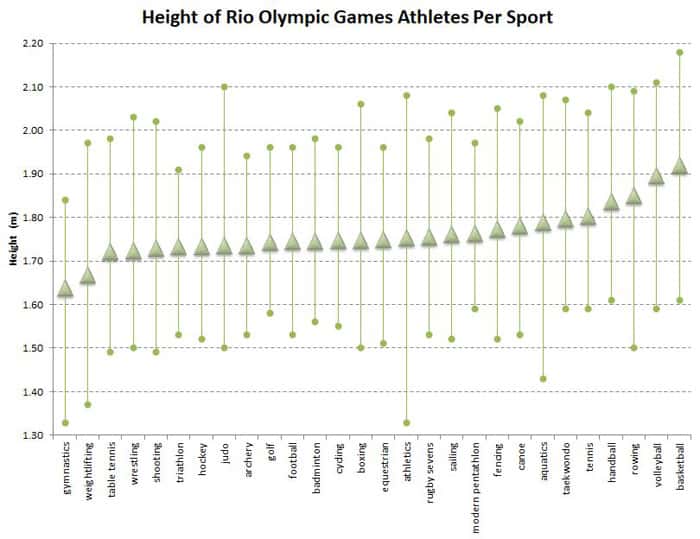
The tallest athlete stood at 2.18m (7' 2"), the Chinese basketball player Muhao Li. The shortest athlete was 17-year-old Brazilian gymnast Flavia Saraiva, standing only 1.33m (4' 4.5") tall.
| Average | Minimum | Maximum | n | ||
|---|---|---|---|---|---|
| Males | m | 1.82 | 1.45 | 2.18 | 6142 |
| ft, inches | 5' 11.5" | 4' 9" | 7' 2" | 6142 | |
| Females | m | 1.70 | 1.33 | 2.03 | 5066 |
| ft, inches | 5' 7" | 4' 4.5" | 6' 8" | 5066 | |
| All | m | 1.77 | 1.33 | 2.18 | 11208 |
| ft, inches | 5' 9.5" | 4' 4.5" | 7' 2" | 11208 |
Basketball had the tallest athletes on average, followed by volleyball and rowing. The shortest athletes were from gymnastics and weightlifting.
Weights of 2016 Olympic Athletes
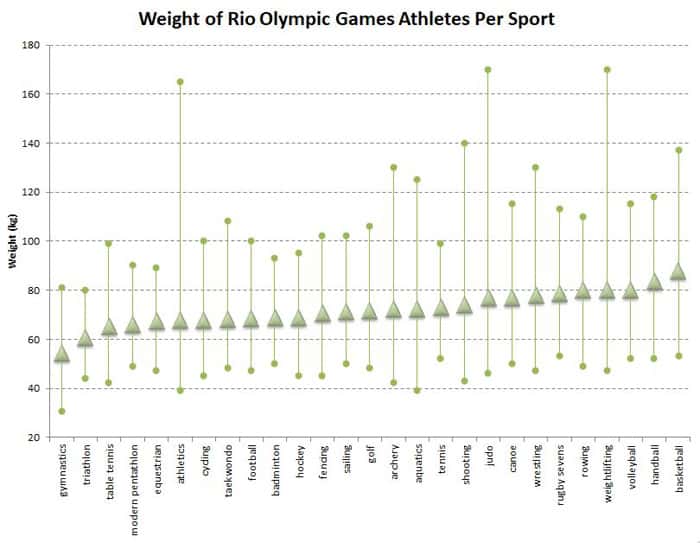
The heaviest athletes were 170 kg (375lbs) - Daniel Natea (judo) and Behdad Salimikordasiabi (weightlifting). The lighted athlete was 17-year-old Brazilian gymnast Flavia Saraiva, at only 31kg (68 lbs) - she was also the shortest.
| Average | Minimum | Maximum | n | ||
|---|---|---|---|---|---|
| Males | kg | 80.1 | 46 | 170 | 5873 |
| lbs | 176.6 | 101 | 375 | 5873 | |
| Females | kg | 62.6 | 31 | 143 | 5006 |
| lbs | 138.0 | 68 | 315 | 5006 | |
| All | kg | 72.0 | 31 | 170 | 10879 |
| lbs | 158.7 | 68 | 375 | 10879 |
Basketball had the heaviest athletes on average (they also had the tallest!), followed by handball, volleyball and weightlifting. The lightest athletes were from gymnastics and triathlon.
BMIs of 2016 Olympic Athletes
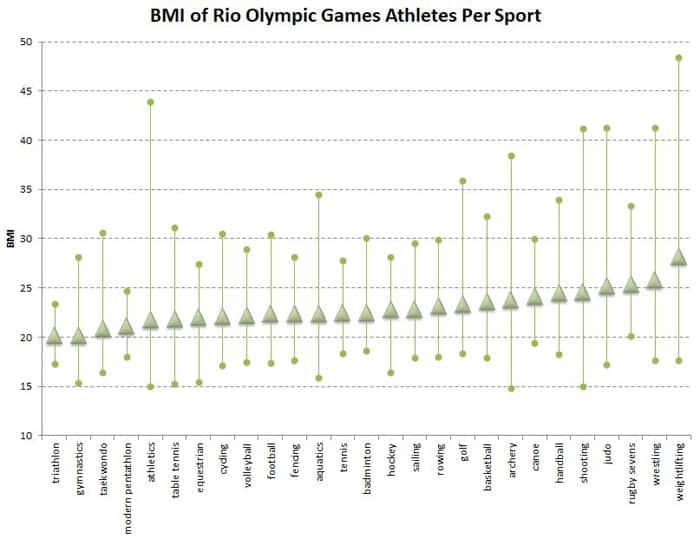
Body Mass Index (BMI) is a commonly used measure of fatness, calculated by dividing body mass (in kg) by the height (in meters) squared. Weight lifters had the highest BMI - the athlete with the highest BMI was female Egyptian weight lifter Shaimaa Haridy at 48.4 (height 1.60m/124kg). The lowest listed BMI was the male archer Sultan Duzelbayev from Kazakhstan, with a BMI of 14.9 (1.76m/46kg).
| Average | Minimum | Maximum | n | |
|---|---|---|---|---|
| Males | 24.0 | 14.9 | 47.1 | 5862 |
| Females | 21.6 | 15.0 | 48.4 | 4996 |
| All | 22.9 | 14.9 | 48.4 | 10858 |
Weightlifting athletes had the highest BMI on average (not surprising as they were one of the heaviest and one of the shortest). Triathletes were the athletes with the lowest BMI.
Age (Years) of 2016 Olympic Athletes
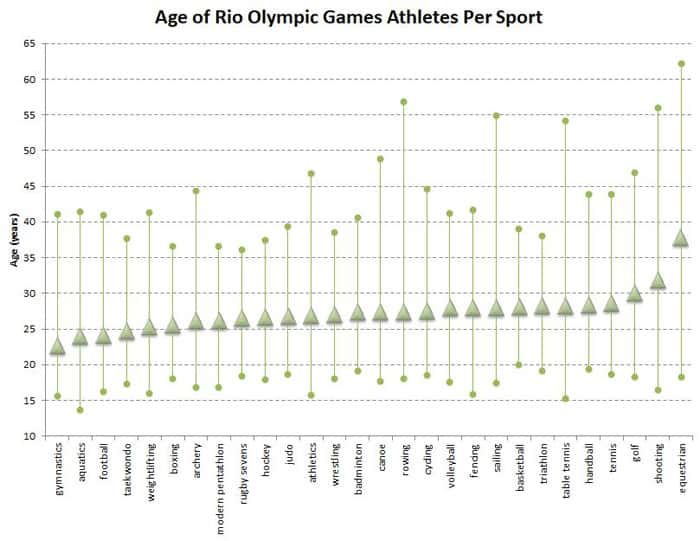
Gymnasts had the lowest average age of 22.6 years – while for the equestrian events the average age of the participants was 37.8 years.
| Average | Minimum | Maximum | n | |
|---|---|---|---|---|
| Males | 27.2 | 14.3 | 61.0 | 6333 |
| Females | 26.3 | 13.7 | 62.3 | 5205 |
| All | 26.8 | 13.7 | 62.3 | 11538 |
The oldest athletes were from the sport of equestrian followed by shooting then golf, the youngest were from gymnastics and aquatics events.
Averages per Sport
Here are the height, weight, BMI and age averages for each sport for males and females. Weight data was not supplied for the sport of boxing. For more detailed results and analysis of the anthropometric scores for each sport, follow the links.
Male Athletes
| Sport | Age (years) | height (m) | weight (kg) | BMI |
|---|---|---|---|---|
| OVERALL MALE AVERAGE (all sports) | 27.2 | 1.82 | 80.1 | 24.0 |
| Aquatics | 24.6 | 1.86 | 82.2 | 23.7 |
| Archery | 25.9 | 1.80 | 80.1 | 24.8 |
| Athletics | 26.9 | 1.81 | 74.7 | 22.6 |
| Badminton | 28.6 | 1.81 | 76.2 | 23.4 |
| Basketball | 28.2 | 2.00 | 100.3 | 24.9 |
| Boxing | 25.2 | 1.76 | ||
| Canoe | 27.3 | 1.82 | 82.2 | 24.7 |
| Cycling | 27.5 | 1.79 | 72.6 | 22.5 |
| Equestrian | 38.3 | 1.79 | 73.0 | 22.8 |
| Fencing | 28.6 | 1.83 | 78.8 | 23.4 |
| Field Hockey | 27.4 | 1.80 | 77.4 | 23.8 |
| Football | 22.6 | 1.79 | 74.5 | 23.0 |
| Golf | 32.5 | 1.79 | 79.0 | 24.6 |
| Gymnastic | 25.2 | 1.68 | 63.3 | 22.4 |
| Handball | 28.9 | 1.91 | 95.4 | 26.0 |
| Judo | 26.6 | 1.78 | 84.6 | 26.4 |
| Modern Pentathlon | 26.6 | 1.83 | 73.9 | 22.2 |
| Rowing | 27.6 | 1.90 | 86.5 | 23.9 |
| Rugby Sevens | 26.5 | 1.83 | 90.5 | 27.0 |
| Sailing | 29.3 | 1.81 | 77.1 | 23.4 |
| Shooting | 33.2 | 1.78 | 81.2 | 25.6 |
| Table Tennis | 28.4 | 1.79 | 72.6 | 22.7 |
| Taekwondo | 24.7 | 1.86 | 74.8 | 21.4 |
| Tennis | 30.1 | 1.86 | 80.4 | 23.2 |
| Triathlon | 27.7 | 1.79 | 66.8 | 20.9 |
| Volleyball | 28.5 | 1.96 | 89.4 | 23.2 |
| Weight lifting | 25.8 | 1.71 | 87.5 | 29.3 |
| Wrestling | 27.5 | 1.76 | 85.6 | 27.3 |
Female Athletes
| Sport | Age (years) | height (m) | weight (kg) | BMI |
|---|---|---|---|---|
| OVERALL FEMALE AVERAGE (all sports) | 26.3 | 1.70 | 62.6 | 21.6 |
| Aquatics | 23.2 | 1.72 | 62.2 | 21.1 |
| Archery | 26.4 | 1.68 | 64.3 | 22.9 |
| Athletics | 26.7 | 1.69 | 60.0 | 20.8 |
| Badminton | 26.2 | 1.69 | 61.2 | 21.5 |
| Basketball | 28.0 | 1.83 | 75.4 | 22.3 |
| Boxing | 27.6 | 1.68 | ||
| Canoe | 27.7 | 1.70 | 66.5 | 23.0 |
| Cycling | 27.4 | 1.67 | 60.2 | 21.5 |
| Equestrian | 36.9 | 1.68 | 58.6 | 20.7 |
| Fencing | 27.4 | 1.71 | 62.7 | 21.3 |
| Field Hockey | 25.9 | 1.67 | 60.4 | 21.7 |
| Football | 25.9 | 1.68 | 61.1 | 21.5 |
| Golf | 27.5 | 1.69 | 63.2 | 22.0 |
| Gymnastic | 21.2 | 1.62 | 49.6 | 19.0 |
| Handball | 27.9 | 1.76 | 70.8 | 22.8 |
| Judo | 26.9 | 1.67 | 65.4 | 23.4 |
| Modern Pentathlon | 25.6 | 1.70 | 58.0 | 20.1 |
| Rowing | 27.1 | 1.77 | 69.8 | 22.1 |
| Rugby Sevens | 26.6 | 1.68 | 66.6 | 23.7 |
| Sailing | 26.4 | 1.69 | 63.2 | 22.0 |
| Shooting | 29.8 | 1.65 | 62.7 | 23.0 |
| Table Tennis | 28.1 | 1.65 | 57.5 | 20.9 |
| Taekwondo | 24.6 | 1.73 | 61.3 | 20.4 |
| Tennis | 26.8 | 1.73 | 64.7 | 21.5 |
| Triathlon | 28.6 | 1.68 | 54.6 | 19.4 |
| Volleyball | 27.4 | 1.83 | 70.7 | 21.1 |
| Weight lifting | 24.6 | 1.60 | 68.8 | 26.4 |
| Wrestling | 26.1 | 1.65 | 61.8 | 22.6 |
The 2016 Athlete Database
There were 11,538 names, from 207 countries and representing 28 sports. Here is the original database. The data supplied was name, country, sex, date of birth, height, weight, sport and medals won. I also calculated BMI and age at the start of the Games. Not all data was complete. There was no body mass data for the sport of boxing, and there were also some height measurements missing. There were 11,208 data points for height, 10,879 for weight, and we were able to calculate BMI for 10,858 competitors. There were a few obvious errors that were corrected - a few athletes had body weight listed in pounds instead of kilograms - a 150kg 100m sprinter? There is expected to be many more errors or inaccuracies, but that was the information supplied.
Related Pages
- Anthropometry at the Summer Olympics
- Athlete data from the 2012 London Olympics and the 2014 Sochi Olympics
- The Tallest Athletes at the Olympic Games
- Anthropometry at the Winter Olympics
- Sport Specific Anthropometry
- Science and the Olympics
- Olympics Anthropology Days
- Link to the original database