Anthropometric measurements can be an important factor in the performance of hockey players. For example, being taller and with a longer arm reach would be considered advantageous, giving the players a greater reach in tackles and for reaching for the ball. For the goal keepers, superior height and reach is particularly advantageous. Below are some height and weight measurements of hockey players, mostly from elite level players. See also our discussion on body-fat measurements in hockey players.
Olympic Athletes
London 2012 Olympic Games
Here is some information from the analysis of the anthropometric data (height, weight and age) from the field hockey participants at the London 2012 Olympic Games. You will notice that the hockey players were shorter and lighter than the average Olympian. We would expect that the height of players from different teams would vary, such as the Asian teams having a small average height than say the Australians or Dutch. There would also be positional differences.
| Sport | Age | Height (cm) | Weight (kg) | BMI |
|---|---|---|---|---|
| OVERALL AVERAGE (all sports) | 26.1 | 176.9 | 72.8 | 23.3 |
| Hockey (all) | 26.0 | 173.2 | 69.0 | 22.9 |
| Hockey (females) | 25.6 | 167.1 | 61.3 | 21.9 |
| Hockey (males) | 26.3 | 180.6 | 78.3 | 24.0 |
Rio 2016 Olympic Games
Here is average data from the analysis of the anthropometric data of the hockey players at the Rio 2016 Olympic Games.
| Age (years) | height (m) | weight (kg) | BMI | |
|---|---|---|---|---|
| AVERAGE (all sports) | 26.8 | 1.77 | 72.0 | 22.9 |
| hockey (all) | 26.6 | 1.73 | 68.9 | 22.8 |
| hockey (females) | 25.9 | 1.67 | 60.4 | 21.7 |
| hockey (males) | 27.4 | 1.80 | 77.4 | 23.8 |
From Research Studies
Here are some measurements the height and weight of hockey players, taken from a range of research studies.
Height. The tallest male hockey players were 180 ± 9.0cm from the Netherlands national team, and the shortest were the Indian National team at 172.5 ± 5.35cm (Table A), which highlights the different physiques according to country of origin. Physique and height also differ with playing position, as Malhotra et al. (1974) found that backs were the tallest (176.6cm), goalkeepers the shortest (167.7cm), and the forwards in between (170.6cm). For females the tallest players measured 168.4 ± 6.5cm and the shortest were college players at 161.6 ± 4.8cm (Table B).
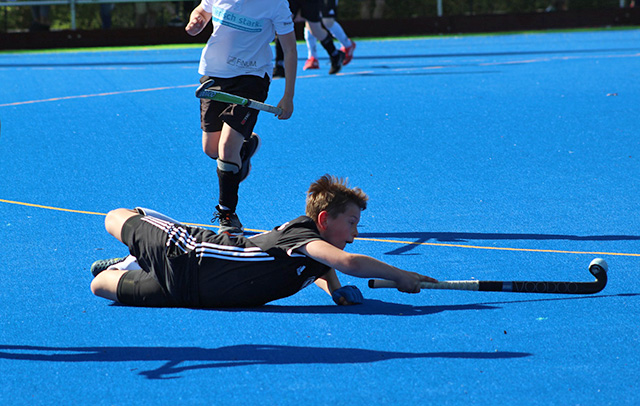
 tall hockey players have a rgeater reach
Weight. A number of male hockey groups have reported weights around 75kg, down to 62.9 ± 6.34 for Olympic level Indian players (Table A). Within this group the body weight of forwards was lighter (60.0kg) than the backs and goalkeepers (67kg). Performance success may be influenced by weight, as the Indian gold medal winning hockey team at the Tokyo Olympics was on average 4.3kg heavier, but the same height as the 'competitive' Indian players in the Manna study (2011). This could be indicative of greater muscle mass. For females, the Italian National team average weight was 57.9 ± 4.2kg, with the highest average for a group of university players measuring at 68 ± 3.6kg (Table B). Wassmer and Mookerjee (2002) noted that female goalkeepers were the heaviest with the highest body fat percentage, while other positional players showed less variety of body composition.
Table A: height and weight data of male hockey athletes
| Author | n | Group | Age (yrs) | Height (cm) | Weight (kg) |
|---|---|---|---|---|---|
| Malhotra et al., 1974 | 24 | Olympic level players | 23.8 ± 2.64 | 172.5 ± 5.35 | 62.9 ± 6.34 |
| Van Erp Baart et al., 1989 | 8 | Elite players | 27 ± 2 | 180.0 ± 9.0 | 75.0 ± 7.7 |
| Scott, 1991 | 162 | State and National players | 24.6 ± 3.9 | 176.3 ± 6.5 | 75.2 ± 8.1 |
| Boyle et al., 1994 | 9 | International level players | 26 ± 4.5 | 177.3 ± 3 | 75 ± 5.4 |
| Manna et al., 2010 | 30 | Indian elite players Baseline data | 23-30 (range) | 174.4 ± 5.2 | 68.9 ± 4.4 |
| Preparation phase | 174.4 ± 5.2 | 69.3 ± 4.4 | |||
| Competition phase | 174.5 ± 5.0 | 69.9 ± 4.4 | |||
| Manna et al., 2011 Total n=120 | 30 | Indian competitive players | U16 | 163.5 ± 2.4 | 53.9 ± 3.9 |
| 30 | U19 | 170.3 ± 3.4 | 60.7 ± 3.7 | ||
| 30 | U23 | 172.7 ± 3.3 | 63.8 ± 3.4 | ||
| 30 | Senior (23-30) | 173.3 ± 3.2 | 64.9 ± 4.4 | ||
| Del Coso et al, 2015 | 13 | Spanish 1st division players | 23.2 ± 3.9 | 181 ± 7 | 76.1 ± 6.1 |
Table B: height and weight data of female hockey athletes
| Author | n | Group | Age (yrs) | Height (cm) | Weight (kg) |
|---|---|---|---|---|---|
| Ready 1987 | 19 | Canadian women's National team | 23.2 ± 2.8 | 162.5 ±5.6 | 58.5 ± 4.8 |
| Marshall & Harber 1996 | 75 | Indoor national championship players | 22.5 ± 3.2 | 162.3 ± 5.5 | 62.3 ± 5.7 |
| Sparling 1998 | 12 | US Olympic women's team | 27 ± 3 | 165 ± 6 | 59.6 ± 3.6 |
| Van Erp Baart 1989 | 9 | Elite hockey | 24 ± 4 | 166.0 ± 3.6 | 62.1 ± 7.4 |
| Astorino 2004 | 13 | University players | 19.7 ± 1.4 | 164 ± 0.6 | 60.7 ± 5.8 |
| Beck 2005 | 15 | College players | 20.6 ± 1.1 | 161.6 ± 4.8 | 59.6 ± 3.4 |
| Beck 2005 | 21 | Senior players | 37.3 ± 10.3 | 166.7 ± 5.3 | 66 ± 4.8 |
| Calo 2009 | 24 | Italian National team | 25.7 ± 3.6 | 163 ± 4.3 | 57.9 ± 4.2 |
| Wassmer 2002 | 37 | NCAA Division II players | 20.2 ± 1.5 | 164.3 ± 5.2 | 63.1 ± 8.6 |
| Krzykala 2015 | 17 | Polish national team | 21 ± 3.8 | 168.4 ± 6.5 | 62.8 ± 6.7 |
| 14 | Youth elite team | 17.3 ± 0.8 | 166.7 ± 7.1 | 62.4 ± 10.9 |
References
- Astorino, T.A., Tam, P.A., Rietschel, J.C., Johnson, S.M., and Freedman, T.P. (2004). Changes in physical fitness parameters during a competitive field hockey season. The Journal of Strength and Conditioning. 18(4), 138-142.
- Beck, B.R., and Doecke, J.D. (2005). Seasonal bone mass of college and senior female field hockey players. Journal of Sports Medicine and Physical Fitness. Sep, 45(3), 347-54.
- Boyle P.M., Mahoney C.A., and Wallace W.F., (1994). The competitive demands of elite male field hockey. Journal of Sports Medicine and Physical Fitness, 34 (3), 235–241.
- Calo, C.M., Sanna, S., Piras I.S., Pavan, P., and Vona, G. (2009). Body composition of Italian female hockey players. Biology of Sport. Jul 26 (1), 23-31.
- Del Coso, J., Portillo, J., Salinero, J.J, Lara, B., Abian-Vicen, J., and Areces, F. (2015) Caffeinated energy drinks improve high speed running in elite field hockey players. IJSNEM, Aug 3
- Krzykala, M., and Leszcynski, P. (2015). Asymmetry in body composition in female hockey players. HOMO - Journal of Comparative Human Biology, 66, 379–386.
- Malhotra, M.S., Joseph, N.T., and Gupta, J.S. (1974). Body composition and endurance capacity of Indian hockey players. Journal of Sports Medicine, 14, 272-277.
- Manna I., Khanna, G. L., and Dhara, P. C. (2010) Effect of Training on Anthropometric, Physiological and Biochemical Variables of Elite Field Hockey Players. International Journal of Sports Science and Engineering, 04 (04), 229-238.
- Manna I., Khanna, G. L., and Dhara, P. C. (2011 ) Morphological, Physiological and Biochemical Characteristics of Indian Field Hockey Players of Selected Age Groups. Al Ameen Journal of Medicine Science, 4 (4), 323-333. ISSN 0974- 1143
- Marshall, J.D., and Harber, V.J. (1996). Body dissatisfaction and drive for thinness in high performance field hockey athletes. International Journal of Sports Medicine, Oct, 17(7), 541-4.
- Ready A.E. (1987) Nutrient intake of the Canadian women's Olympic field hockey team. Canadian Home Economics Journal, 37 (1), 29–32.
- Scott P.A. (1991) Morphological characteristics of elite male field hockey players. Journal of Sports Medicine and Physical Fitness, 31 (1), 57–61.
- Sparling, P.B., Snow, T.K., Rosskopf, L.B., O'Donnell, E.M., Freedson, and Byrnes, W.C. (1998) Bone mineral density and body composition of the United States Olympic women's field hockey team. British Journal of Sports Medicine, Dec, 32 (4), 315-8.
- van Erp-Baart, A.M., Saris, W.H., Binkhorst, R.A., Vos, J.A.,& Elvers, J.W. (1989a). Nationwide survey on nutritional habits in elite athletes. Part I. Energy, carbohydrate, protein, and fat intake. International Journal of Sports Medicine, 10(S1), S3–S10.
- Wassmer D.J., and Mookerjee S., (2002). A descriptive profile of elite U.S. women's collegiate field hockey players. Journal of Sports Medicine and Physical Fitness, 42 (2), 165–171.
Related Pages
- Hockey Player Anthropometry
- How to measure Height and Weight
- Body Composition of Field Hockey Players
- Fitness Components for Field Hockey
- Fitness testing for hockey
- Olympic Games Anthropometry for other sports in 2012
- All about fitness testing, including anthropometry testing
- Also see the field hockey Fitness Rating Page
- Poll about the fitness components for field hockey


 Current Events