Pre-game hydration status of athletes competing at the 2001 Arafura games in Darwin
Wood, R.J., Finn, J.P., Marsden, J.F., Pre-game hydration status of athletes competing at the 2001 Arafura games in Darwin, Proceedings of the Australian Conference of Science and Medicine in Sport, 2001: A Sports Medicine Odyssey challenges, controversies and change.
This study assessed the pre-competition hydration status of male athletes from the sports of volleyball (n=43), touch (n=32) and basketball (n=18) during the Arafura Games. All athletes were tested prior to their first game, then 68 of these were retested 3-4 days later. Each time they provided a urine sample for determination of urine specific gravity (Usg) and color (Ucol). A questionnaire on the previous 24 hours activities was also completed. The mean Usg of all samples was 1.020 ± 0.008, with 8% classified as hypohydrated, 70% as euhydrated and 22% hyperhydrated. There was no difference between the first and second samples. Touch had a greater percentage of players in each of the hypohydrated and hyperhydrated range. There was no relationship of Usg with age, acclimatization status, alcohol consumption, caffeine consumption and activity level. Previous 24 hr fluid intake was negatively associated with Usg. There was a high correlation (r=0.87) between Ucol and Usg, though Ucol tended to underestimate hydration levels. Generally hydration levels were better than previously published results, though many athletes were still hypohydrated and therefore at risk of heat stress. Recommendations for future similar events are to increase hydration education and awareness for all athletes, irrespective of acclimatization level. Ucol can be used by athletes as a simple, inexpensive and immediate measure to monitor hydration status prior to exercise.
Extended Rerport (unpublished)
INTRODUCTION
The ACSM position stand on fluid replacement (ACSM, 1996) recommends that individuals "drink adequate fluids during the 24-h period before an event…to promote proper hydration before exercise or competition". Athletes who begin exercise with less than normal volume of body water are likely to experience adverse effects on cardiovascular function, temperature regulation and exercise performance (Lamb & Shehata, 1999). The effect of hypohydration (reduced body fluids) is likely to be exacerbated when competing in a tropical environment, particularly when competing in a series of events over a number of days. Hypohydration by as little as 2% decrease in body mass may affect performance (Armstrong et al. 1985). Hypohydration has been shown to reduce aerobic performance (Barr, 1999), the performance of intermittent sprints (Maxwell et al. 1999) and performance in team games (Burke & Hawley, 1997). Furthermore, dehydrated athletes competing in a hot climate are at greater risk of heat injury (Sawka 1992).
The Arafura games are held in Darwin, in the tropical north of Australia, every two years. The 2001 event was held in May, where the average outdoor maximum temperature is 32.0oC with an overnight minium average of 22.1oC. The competition included 26 sports, over 20 nations and over 3000 athletes. Some athletes were not acclimatised to the heat, and subsequently their hydration status may have been compromised. The local athletes, and many visiting athletes, may be acclimatised to the conditions they will encounter, though they may be influenced by other factors that can impact on their hydration status, such as changes to diet and activity levels.
There are many methods for determining hydration status, including monitoring body mass changes, and measuring various blood and urine markers. Urinalysis has been shown to be a valid and reliable method for determining moderate changes in fluid balance. Recommendations about fluid intake for athletes are primarily to ensure adequate hydration levels for competition. Therefore, measurement of pre-game hydration status could be considered more critical.
The aim of this study was to assess the pre-competition hydration status of athletes at the Arafura Games. Particularly, athletes from different sports and regions were compared, and the impact of activities during the previous 24 hours was determined. The measures were repeated to determined if there were differences over the course of the tournament. Based on these results, recommendations for teams at future Arafura Games and similar tournaments held in tropical conditions will be compiled.
METHODS
Subjects comprised 93 male athletes (average age 25 ± 5 years) competing at the Arafura Games in the sports of indoor volleyball (n=43), touch football (n=32) and basketball (n=18). Of these, 68 athletes were tested on a second occasion. The athletes were tested prior to their first game of the tournament, and again prior to the final game before the finals. The time between tests was 3 days for touch football and 4 days for volleyball and basketball.
Approximately one hour prior to the scheduled game starting time the athletes were approached and details of the study explained. The athletes had no prior warning of the test taking place so they could not adjust their regular routines. There was also no warning of another sample being required later in the tournament.
The athletes were required to complete an informed consent form and a short questionnaire to provide details on certain activities undertaken during the previous 24 hours, including their fluid intake and activity level, the amount of alcohol and caffeine consumed, whether they had taken vitamin supplements and whether they had any adverse effects from the heat.
The athletes then provided a small urine sample, of which urine specific gravity (Usg) wand urine colour (Ucol) was determined (using an eight-scale chart) (Armstrong, 2000). Athletes who indicated that vitamin supplements had been taken in the previous 24 hours (33 samples) were excluded from the analysis of Ucol as this can cause unusual colour changes.
RESULTS AND DISCUSSION
Are athletes arriving at their events in a dehydrated state?
There is no 'gold standard' measure of hydration status, and also no clear definition of what are recommended levels (Shirreffs, 2000). Armstrong et al. (1994) classified three levels of hydration, well-hydrated (Usg <1.013), normally hydrated (Usg 1.013-1.029), and dehydrated (Usg >1.029). In the current study, most athletes (70%) arrived at their sporting event in the normally hydrated state (Table 1). The mean Usg of all samples was 1.020 ± 0.008, with only 8% of all samples classified as dehydrated. These results show better hydration levels than in a study by Armstrong (1994), where the mean pre-exercise Usg in 12 male tennis players was 1.023 ± 0.006, with no players presenting with a Usg below 1.012, compared to 20% of players in the current study.
Is there a difference in hydration level for athletes from different sports?
Table 1 shows the breakdown of hydration ranges for each sport. While touch football had the greater percentage of players that were well-hydrated, they also had the highest percentage of dehydrated players. Differences between sports may be a result of the sports being played under different environmental conditions, and therefore the emphasis and preparation of the players may differ. Volleyball was played in an air-conditioned indoor stadium (24oC, 50% humidity), basketball indoors with no air-conditioning (28oC, 48% humidity), and touch football outdoors in the early evening (24oC, 64% humidity). There appeared to be a greater emphasis on good hydration by the coaches and trainers involved with touch football, possibly a result of a recent incident of heat stress in a player during a tournament event, and the game being played outdoors.
TABLE 1: Number of samples (expressed as a percentage in parenthesis) showing athletes being well hydrated, normally hydrated and dehydrated. The data is shown for all subjects combined (n=161) and for each sport.
|
overall |
volleyball |
touch football |
basketball |
| well hydrated | 36 (22.4%) | 13 (16.5%) | 16 (34.8%) | 7 (19.4%) |
| euhydrated | 112 (69.6%) | 63 (79.7%) | 23 (50.0%) | 26 (72.2%) |
| dehydrated | 13 (8.1%) | 3 (3.8%) | 7 (15.2%) | 3 (8.3%) |
Is there a difference between athletes from cooler climates to those acclimatised to the heat?
The sample was divided into two groups based on those that have lived in a tropical region for greater than or less than six months. The athletes from the tropical region were further divided into those who travelled to Darwin and the local athletes. There was no difference in the mean Usg between those who have lived in a tropical region for greater than six months (1.019 ± 0.008, n=40) and those who had not (1.020 ± 0.009, n=53). There was similarly no difference between those in the tropical group who were locals (1.020 ± 0.009, n=29) and those who had travelled to Darwin (1.021 ± 0.009, n=11). The distribution of values into hypohydration, euhydration and hyperhydration ranges were also not different between these groups.
Does the hydration level of athletes change over the course of the tournament?
The mean Usg level was no different for the first (1.018 ± 0.009) and second samples (1.020 ± 0.008). Similarly, Armstrong et al. (1994) found no change in pre-exercise Usg over three consecutive days of a tennis tournament. The athletes were somewhat consistent in their hydration level from one test to the other. Figure 1 shows that there was a small though highly significant relationship between the Usg of the first and second sample (r=0.42).
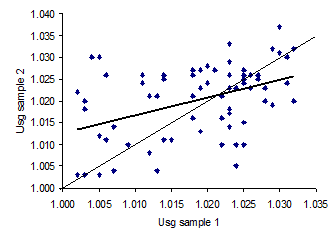
Figure 1: Relationship between Usg level for the first and second sample (n=68). The regression line (r=0.42) and the line of identity (dotted) are shown.
Are there any factors that predispose athletes to be dehydrated?
The other details that were recorded that may affect pre-game hydration level include age, fluid intake, alcohol consumption, caffeine consumption and activity level. Analyses were performed on the first samples only. Of these factors, fluid intake rating appeared to be the only significant factor, with a better fluid intake self-rating associated with better hydration. The athletes that rated their fluid intake as very poor or poor (n=11) had a mean Usg of 1.024 ± 0.006 (range 1.013-1.032), while those rating themselves very good or excellent (n=25) had a mean Usg of 1.017 ± 0.008 (range 1.002-1.031). However, there were several athletes whose perception of their fluid intake did not correspond to their Usg level. Without further education, and use of other measures such as Ucol, these are the athletes at a high risk of the adverse effects of hypohydration.
Is urine colour a useful marker of pre-exercise hydration status?
Previous studies have shown significant correlations between measures of Usg and Ucol (r=0.80 Armstrong et al. 1994; r=0.68 Armstrong et al. 1998). In the current study there was also a high correlation (n=128, r=0.87) between Ucol and Usg (Figure 2). Compared to the range of Usg values, the Ucol tended to indicate better hydration levels. A Ucol rating of 1, 2 or 3 is considered to be well-hydrated (Armstrong, 2000). There were 43% of samples rated in this range, compared to 22% of samples rated as well hydrated based on Usg values. Also, using Ucol, only 3% rated as dehydrated (colour rating 7 or 8), compared to 8% based on Usg values. Despite these differences, these results still support using Ucol as a simple, inexpensive and immediate measure to monitor hydration status by athletes.
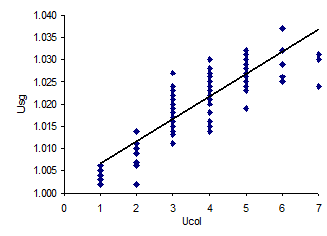
Figure 2: Relationship between urine colour (Ucol) and urine specific gravity (Usg), showing the line of best fit (n=128, r=0.87).
CONCLUSIONS
It is of great importance to know the hydration status of athletes just prior to competition. At such a time, Usg or other similar laboratory measures may not always be available. Ucol was shown to be a valid and easily determined alternative, as long as athletes are aware that certain foods, medications, vitamin supplements, illnesses and exercise may all influence urine colour.
The hydration levels of selected team sports athletes at the Arafura Games were better than previously published results. However, there were still many athletes with Usg levels indicating hypohydration and therefore putting them at risk of heat stress. Recommendations for future sporting events held in a tropical environment are to increase education of the athletes on the importance of good hydration, both for local and visiting athletes, irrespective of prior experience of exercising in tropical environments. Urine colour charts could become part of the information package for competing athletes.
While it is recommended that players are well-hydrated prior to the event, there is no clear evidence of benefits with being well hydrated (Latzka & Sawka, 2000). Therefore, the recommendations should be aimed at avoiding hypohydration. Only 8% of athletes were categorised as being dehydrated, though the distribution of Usg values showed many more were close to the dehydrated level. These are the athletes that could benefit most with more education about hydration.
REFERENCES
- American College of Sports Medicine (1996). Position Stand on Exercise and Fluid Replacement, 29(1): i-vii.
- Armstrong, L.E, Costill, D.L., Fink, W.J., (1985). "Influence of diuretic‑induced dehydration on competitive running performance." Med. Sci. Sports Exerc. 17: 456-61.
- Armstrong, L.E., Maresh, C.M., Castellani, J.W., Bereron, M.F., Kenefick, R.W., LaGassee, K.E., and Riebe, D. (1994). "Urinary Indices of Hydration Status.", Int. J. Sport Nutr., 4, 265-279.
- Armstrong, L.E., Soto, J.A., Hacker, F.T., Casa, D.J., Kavouras, S.A., Maresh, C.M. (1998). “Urinary indices during dehydration, exercise, and rehydration.” Int. J. Sport Nutr. 8: 345-355.
- Armstrong, L.E. (2000). Performing in Extreme Environments, Human Kinetics, Champaign, IL.
- Barr, S.I. (1999). “Effects of dehydration on exercise performance.” Can. J. Appl. Physiol. 24:164-172.
- Burke, L.M. and Hawley, J.A. (1997). “Fluid balance in team sports.” Sports Med. 24: 38-54.
- Lamb, D.R., Shehata, A.H. (1999). "Benefits and limitations to prehydration" GSSI Sport Sci. Exchange, Vol 12 (2).
- Latzka, W.A. and Sawka, M.N. (2000). "Hyperhydration and glycerol: thermoregulatory effects during exercise in hot climates." Can. J. Appl. Physiol. 25(6): 536-545.
- Maxwell, N.S., Garner, F. and Nimmo, M.A. (1999). “Intermittent running: muscle metabolism in the heat and effect of hypohydration.” Med. Sci. Sports Exerc. 31: 675-683.
- Sawka, M.N. (1992) “Physiological consequences of hypohydration: exercise performance and thermoregulation” Med. Sci. Sports Exerc. 24: 657-670.
- Shirreffs, S.M. (2000) "Markers of hydration status", J. Sports Med. Phys. Fitness, 40: 80-84.
Related Pages
- Pre-Exercise Hydration
- Finn, J.P., Wood, R.J., 'Incidence of pre-game hydration in athletes competing at an international event in dry tropical conditions.' Nutrition and Dietetics, Vol 61 p221-225, 2004.
- Full list of research papers by Rob Wood